A 1% increase in U.S. ethanol blending could shift nearly 486 million bushels of corn demand — roughly equal to the annual production of a major corn-producing state. That single statistic explains why the impact of US ethanol policy on corn demand is not a secondary factor, but a structural force shaping American agriculture.
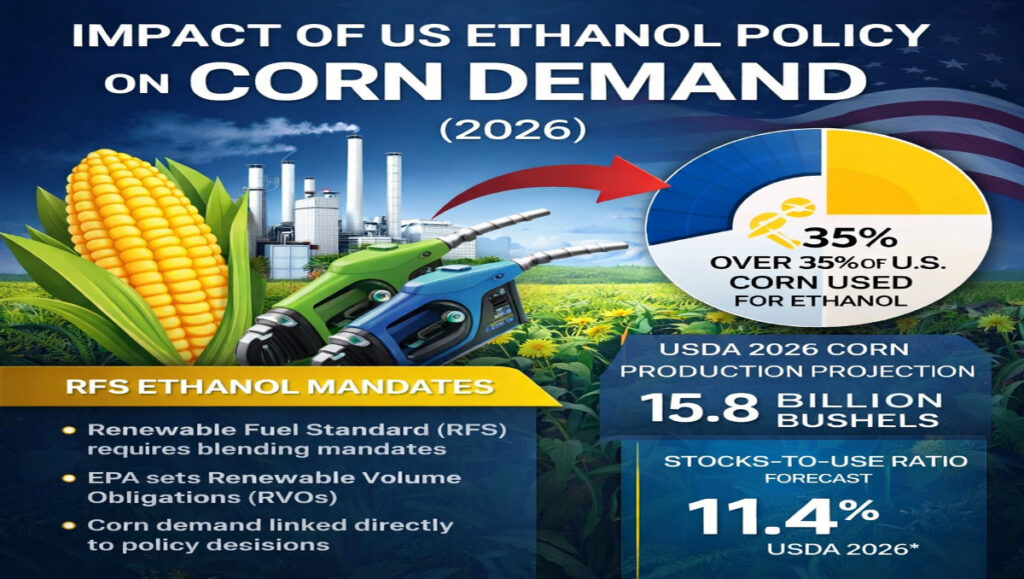
According to the USDA’s February 2026 outlook, U.S. corn production is projected at 15.8 billion bushels, down about 7% from the prior year. Yet corn use for fuel ethanol is forecast at 5.6 billion bushels, essentially unchanged. With over one-third of the crop flowing into ethanol, federal blending mandates under the Renewable Fuel Standard (RFS) directly influence prices, stocks, acreage decisions, and futures volatility.
Understanding this policy mechanism is essential for farmers, ethanol producers, and commodity investors heading into 2026.
Key Takeaways
- The impact of US ethanol policy on corn demand is structural, not cyclical
- USDA projects 5.6 billion bushels of corn for ethanol in 2026–27
- Production forecast at 15.8 billion bushels
- Ending stocks projected at 1.8 billion bushels (11.4% stocks-to-use)
- A 1% blending increase could add ~486 million bushels of demand
Table of Contents
- What Is US Ethanol Policy?
- The Renewable Fuel Standard and RVO Mandates
- USDA 2026 Corn Supply and Ethanol Outlook
- Why the Impact of US Ethanol Policy on Corn Demand Is Structural
- Blending Rates and Demand Sensitivity Modeling
- Corn Market Structure: Stocks, Acreage, and Pricing
- Policy Constraints: The Blend Wall and Gasoline Demand
- What This Means for Investors
- FAQ: Impact of US Ethanol Policy on Corn Demand
- Final Thoughts
What Is US Ethanol Policy?
U.S. ethanol policy is governed primarily by the Renewable Fuel Standard (RFS), enacted in 2005 and expanded in 2007. The RFS requires refiners to blend renewable fuels — predominantly corn-based ethanol — into the national gasoline supply.
The Environmental Protection Agency sets annual Renewable Volume Obligations (RVOs), determining how many gallons must be blended. Because ethanol production relies almost entirely on corn feedstock, these mandates create a baseline level of corn demand independent of export volatility.
This policy framework permanently integrated energy markets with agricultural markets.
The Renewable Fuel Standard and RVO Mandates
Under the RFS system:
- Refiners must meet blending targets
- Compliance is tracked through Renewable Identification Numbers (RINs)
- Annual RVO adjustments influence ethanol plant utilization rates
If RVO targets rise, ethanol producers procure more corn. If mandates are reduced or delayed, procurement slows and supply shifts toward feed or export channels.
This is the core transmission mechanism behind the impact of US ethanol policy on corn demand.
Official Renewable Volume Obligations (RVOs) and policy updates are published annually by the U.S. Environmental Protection Agency (EPA) under the Renewable Fuel Standard program.
USDA 2026 Corn Supply and Ethanol Outlook
The USDA projects the following for 2026–27:
- Production: 15.8 billion bushels
- Planted area: 94 million acres
- Yield: 183 bushels per acre
- Ethanol use: 5.6 billion bushels
- Ending stocks: 1.8 billion bushels
- Stocks-to-use ratio: 11.4%
- Season-average farm price: $4.20 per bushel
Despite lower production, ethanol use remains steady. That stability reinforces the structural nature of policy-driven demand.
An 11.4% stocks-to-use ratio reflects a balanced but not burdensome supply environment. The market remains sensitive to yield shocks or mandate adjustments.
For broader agricultural supply-demand dynamics, see our analysis on How Droughts and Weather Patterns Impact Corn Prices, which explains how weather shocks compound ethanol-driven demand shifts.
The latest production and usage projections are detailed in the USDA WASDE (World Agricultural Supply and Demand Estimates) Report.
Why the Impact of US Ethanol Policy on Corn Demand Is Structural
Unlike export demand, which fluctuates with global competition, ethanol demand is anchored by federal mandate.
Approximately 5.6 billion bushels are absorbed annually by ethanol plants. This creates a predictable floor in the corn balance sheet.
Because acreage decisions are made months in advance, policy stability influences planting incentives, regional basis strength, and capital investment in ethanol infrastructure.
The integration of policy and agriculture makes ethanol demand structurally embedded, not speculative.
For a wider perspective on renewable policy influence across commodities, read How Renewable Energy Trends Impact Fossil Fuel Commodities, where we examine structural demand transitions.
Blending Rates and Demand Sensitivity Modeling
Blending levels determine corn intensity per gallon of gasoline.
E10 is standard nationwide, while E15 expansion remains a key growth driver. Analysts estimate that a 1% increase in national blending could increase corn demand by roughly 486 million bushels.
If ethanol demand rose by 300 million bushels under higher blending mandates, the stocks-to-use ratio could decline toward 10% or lower. Historically, sub-10% ratios have been associated with elevated price volatility and upward futures pressure.
This modeling illustrates how relatively small regulatory adjustments can materially tighten the supply-demand balance.
Corn Market Structure: Stocks, Acreage, and Pricing
With 5.6 billion bushels allocated to ethanol, corn market mechanics are policy-sensitive.
Stronger ethanol demand typically leads to:
- Tighter ending stocks
- Stronger regional basis in ethanol-heavy states
- Increased acreage allocation in subsequent planting seasons
- CME futures volatility around EPA announcements
At a projected $4.20 season-average price, the market reflects moderate equilibrium. However, tighter supplies or higher blending rates could shift pricing dynamics quickly.
Policy stability therefore influences not only demand volume, but forward price structure.
Corn demand trends also interact with energy markets especially gasoline consumption and crude oil pricing as discussed in our report on How OPEC Meetings Impact US Gasoline Prices.
Policy Constraints: The Blend Wall and Gasoline Demand
Long-term growth in ethanol demand faces structural constraints.
The “blend wall” limits how much ethanol can be absorbed into gasoline without higher blending approvals. Declining gasoline consumption due to electric vehicle adoption and fuel efficiency improvements may cap total ethanol growth unless E15 expansion accelerates.
Future adjustments to RVO targets, small refinery exemptions, and year-round E15 approvals will determine whether corn demand remains flat or expands.
These regulatory variables will define the next phase of ethanol-driven corn consumption.
What This Means for Investors
For investors, ethanol policy functions as a demand stabilizer with measurable triggers.
Corn futures at the CME often respond to EPA RVO announcements and USDA balance sheet revisions. Ethanol crush margins signal plant profitability and procurement intensity. RIN prices reflect compliance pressures within the blending system.
Forward-looking indicators to monitor include:
- EPA annual RVO announcements
- USDA WASDE updates on ethanol use
- Year-round E15 regulatory approvals
- Crude oil price movements affecting ethanol competitiveness
The impact of US ethanol policy on corn demand provides actionable insight into potential shifts in volatility, acreage response, and price momentum.
Ethanol production data and weekly gasoline demand statistics are tracked by the U.S. Energy Information Administration (EIA).
FAQ: Impact of US Ethanol Policy on Corn Demand
How much corn does ethanol use in 2026?
The USDA projects 5.6 billion bushels for fuel ethanol in 2026–27.
What is the projected stocks-to-use ratio?
Approximately 11.4% for 2026–27.
How sensitive is corn demand to blending increases?
A 1% increase in national blending could raise corn use by roughly 486 million bushels.
Who determines ethanol blending mandates?
The Environmental Protection Agency sets Renewable Volume Obligations under the Renewable Fuel Standard.
Final Thoughts
The impact of US ethanol policy on corn demand is deeply embedded in the structure of U.S. agriculture. With 5.6 billion bushels forecast for ethanol use and a projected 11.4% stocks-to-use ratio, policy decisions continue to anchor the demand side of the corn balance sheet.
While production varies with acreage and yield, blending mandates provide a measurable floor beneath corn demand. Monitoring RVO announcements, E15 expansion, and USDA balance sheets offers a structural lens for interpreting price movements rather than reacting to short-term headlines.
Ethanol policy is not a peripheral variable — it is central to understanding U.S. corn market dynamics in 2026 and beyond.
Author
US Commodity Research Team
Focused on structural analysis of U.S. agriculture, energy, and industrial commodity markets.
Disclaimer
This article is for informational purposes only and does not constitute investment advice. Commodity markets are subject to policy changes, weather risk, and macroeconomic conditions