WTI crude oil is trading near $66.5, slightly lower on the session, but price behavior continues to reflect structural compression rather than directional conviction. Beneath surface volatility, price is rotating just below the R1 resistance region after prior equilibrium recovery.
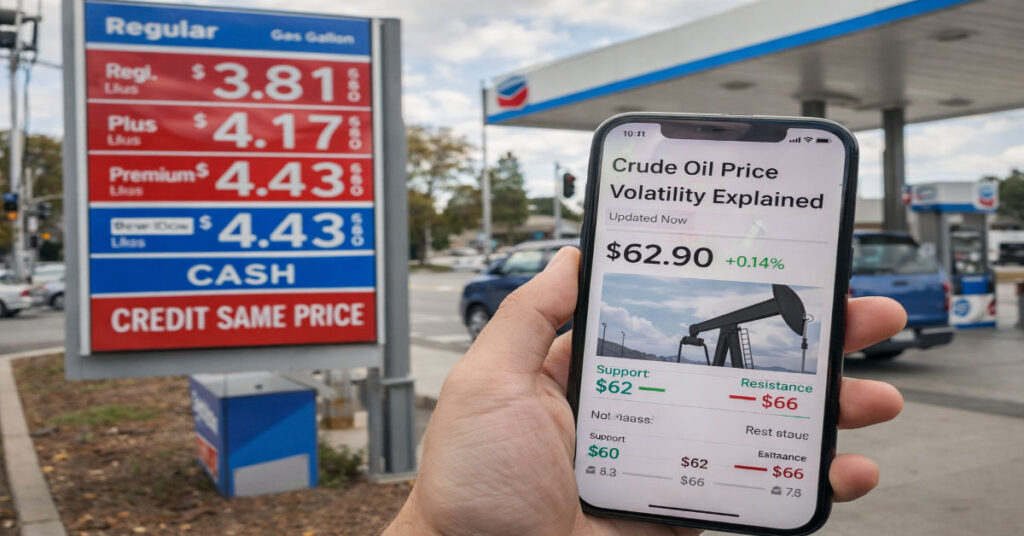
For traders watching structure, crude oil price volatility explained through order flow suggests a market balancing inventory sensitivity and macro positioning rather than trending decisively.
Over recent sessions, WTI has rotated between $63 and $67, repeatedly testing upper resistance without sustained breakout follow-through. While headlines focus on geopolitical narratives, price behavior reflects measured positioning resets inside a defined range.
Understanding crude oil price volatility explained through structure helps traders avoid emotional reactions and focus on observable price behavior.
This update breaks down crude oil price volatility explained using technical structure, macro drivers, and volatility cycles ,not predictions.
What Is Happening in the Oil Market Today?
Crude oil remains within a structured range after rebounding from the mid-$62 pivot region. After testing the $66.7 resistance zone, upside momentum is encountering supply friction.
Current behavior suggests:
- Testing of R1 resistance (~66.7)
- Controlled higher-low structure above 63
- Balanced participation between buyers and sellers
- No confirmed breakout structure
The market is not collapsing. It is not breaking out. It is compressing.
Compression phases often precede expansion but only when a catalyst emerges. Until then, price structure matters more than headlines.
Today’s oil market reflects:
- Inventory sensitivity
- Dollar fluctuations
- Rate expectation adjustments
- Positioning resets
This is not a trending market. It is a decision point market.
Crude Oil Price Volatility Explained Through Technical Structure
Understanding crude oil price volatility explained through technical structure requires looking beyond headlines and focusing on how price behaves around key levels.
WTI crude oil rarely moves randomly. Most volatility clusters occur near:
- Major support zones
- Resistance supply areas
- Weekly pivot levels
- Inventory reaction zones
- Breakout or breakdown structures
Currently, WTI is trading near a defined pivot region where prior buying and selling pressure previously intensified. When price compresses near such areas, volatility often contracts before expanding again.
1.Support and Resistance Dynamics
Volatility tends to increase when:
- Price approaches major resistance and sellers defend
- Price retests strong support after a rally
- Liquidity pools above or below prior highs/lows are triggered
For example, a failure to break above $66–$67 resistance can cause fast downside rotation toward $62–$60 support. That move itself is not random, it is structural repositioning.
2.Volatility Compression Before Expansion
One of the most important concepts in crude oil price volatility explained is volatility contraction.
When daily ranges narrow and candles overlap:
- Participation becomes selective
- Market waits for catalyst
- Breakout probability builds
This compression phase often precedes:
- Inventory-driven expansion
- Dollar index reaction
- OPEC headline impact
3.Pivot Zones and Reaction Areas
Pivot levels act as equilibrium markers.
When price holds above pivot:
- Buyers remain structurally active
When price fails below pivot:
- Short-term bias shifts neutral or bearish
These reaction areas create predictable volatility waves not forecasts, but structural rotations.
4.Liquidity and Stop Clusters
Crude oil markets are highly liquid but still sensitive to stop-loss clusters.
Volatility spikes commonly occur when:
- Stops above recent highs are triggered
- Stops below prior lows are swept
- Large traders rebalance positions
These movements can look emotional, but they are often liquidity-driven.
Key Takeaway
Crude oil price volatility explained through technical structure shows that:
- Volatility expands near key levels
- Compression phases signal buildup
- Breakouts are usually liquidity events
- Structure matters more than headlines
Understanding these patterns allows traders and investors to interpret oil price swings objectively rather than emotionally.
Key Technical Levels in Today’s Crude Oil Price Volatility Explained
Understanding structure is central to Crude Oil Price Volatility Explained.
Support Levels
- Immediate Support: $62.00 – $61.00
- Major Structural Support: $58.50 – $56.00
- Extended Breakdown Level: $51.90
Holding above $61 keeps the broader consolidation intact. A break below $58.50 would signal structural weakness rather than short-term noise.
Resistance Levels
- Immediate Resistance: $66.50 – $67.00
Major Resistance: $69.25
Higher Resistance: $73.35
Failure to clear $66–67 repeatedly suggests supply absorption above current price.
Pivot Structure
WTI continues rotating around the $62.50 pivot zone. Pivot compression indicates equilibrium — not directional dominance.
When pivots tighten, volatility often declines temporarily before expanding.
Is Crude Oil Price Volatility Expanding or Contracting?
Volatility is currently contracting, not expanding.
Recent sessions show:
- Narrower daily ranges
- Reduced impulsive candles
- Lower intraday extensions
Volatility cycles move in waves:
- Expansion phase (sharp directional move)
- Pause phase (range compression)
- Breakout phase (new expansion)
WTI appears to be in Phase 2.
Lower volatility does not mean weakness. It means participants are reassessing.
For traders, volatility contraction often presents:
- Lower risk entries
- Defined invalidation levels
- Structured setups
For long-term investors, contraction phases reduce emotional trading and improve clarity.
What Is Driving Crude Oil Price Volatility Right Now?
US Dollar Index Impact
Oil trades inversely to the dollar in many short-term cycles. A stronger dollar pressures oil by increasing global purchase costs.
Recent dollar stabilization has limited aggressive oil upside.
Federal Reserve Policy & Rates
Higher rates reduce liquidity. Reduced liquidity tightens speculative flows.
Oil is sensitive to:
- Rate hike expectations
- Inflation trajectory
- Real yield shifts
When real yields rise, commodities often pause.
EIA Inventory Data
Weekly inventory releases from the U.S. Energy Information Administration (EIA) frequently trigger intraday volatility.
Inventory builds = short-term pressure
Inventory draws = short-term support
However, current inventory trends show mixed signals, not extreme tightness.
According to the U.S. Energy Information Administration (EIA), weekly crude oil inventory reports often trigger short-term volatility spikes.
OPEC+ Supply Decisions
OPEC production adjustments remain a structural driver.
Markets currently perceive:
- Stable supply policy
- No immediate shock tightening
- Balanced production management
Without surprise cuts or supply disruptions, volatility remains contained.
US Economic Growth & Demand
Oil demand depends heavily on:
- US GDP expectations
- Manufacturing activity
- Transportation demand
Recent data reflects moderate expansion, not overheating.
Demand optimism is present ,but not explosive.
Bullish Scenario for WTI Crude Oil
The bullish case requires:
- Sustained close above $67
- Break above $69.25
- Increasing volume participation
If price clears resistance with momentum, volatility expansion could resume toward $73+.
Catalysts that could support bullish expansion:
- Strong inventory draws
- Dollar weakness
- OPEC tightening
- Improved global growth data
However, bullish continuation requires structural confirmation , not just headlines.
Bearish Scenario for Crude Oil
The bearish case activates if:
- $61 fails decisively
- Price loses $58.50 structural support
- Dollar strengthens aggressively
Below $58.50, downside volatility may expand toward $52.
Bearish catalysts:
- Weak demand data
- Inventory builds
- Recession concerns
- Dollar breakout
Currently, bearish structure is not dominant , but support levels must hold.
Short-Term Outlook: Consolidation or Expansion?
The most probable near-term scenario is continued consolidation.
Why?
- No strong macro catalyst
- No technical breakout
- Balanced positioning
Expansion is possible — but not confirmed.
Traders should monitor:
- Range boundaries
- Inventory reaction
- Dollar momentum
- Volume spikes
Until then, oil remains structurally neutral within defined parameters.
What Crude Oil Price Volatility Means for Beginners
Volatility simply means the speed and size of price movements.
High volatility = fast, wide swings
Low volatility = narrow, slower movement
Key terms explained:
Support – Area where buyers step in
Resistance – Area where sellers appear
Consolidation – Price pause after a move
Pivot Level – Equilibrium price zone
Right now, oil is consolidating. That means the market is pausing , not deciding.
Understanding volatility cycles helps beginners avoid emotional trades.
Frequently Asked Questions
Why is crude oil price so volatile right now?
Oil volatility reflects supply-demand shifts, dollar movement, rate expectations, and inventory data. Currently, volatility is contracting due to balanced participation rather than aggressive directional pressure.
What causes crude oil price swings?
Major causes include OPEC production decisions, US inventory data, geopolitical risk, economic growth expectations, and Federal Reserve policy shifts.
Is crude oil price volatility bullish or bearish?
Volatility itself is neutral. It simply measures movement speed. Current structure suggests consolidation rather than bullish or bearish dominance.
How does the US dollar affect crude oil?
A stronger dollar often pressures oil because global buyers must pay more in local currency. A weaker dollar tends to support oil prices.
What are key support levels in WTI today?
Immediate support sits near $62–$61. Major structural support lies between $58.50–$56. A breakdown below those zones would alter structure significantly.
Conclusion: Structure Before Speculation
Crude oil is not breaking out. It is not collapsing. It is compressing.
Understanding Crude Oil Price Volatility Explained through structure allows traders and investors to stay grounded in observable price behavior rather than reacting emotionally to headlines.
Until resistance or support breaks decisively, the current phase favors discipline over prediction.
This guide on crude oil price volatility explained shows how structure, not headlines, drives oil markets.
👉 Read our full Crude Oil Price Today analysis for daily updates.
👉 See how Gold Price Volatility compares with oil markets.
👉 See live US Commodity market prices.
Bookmark this page for daily US crude oil structure updates.