The impact of US shale production on spot oil prices has permanently altered global energy market dynamics. US crude production rose from roughly 5 million barrels per day in 2008 to over 13 million barrels per day at its recent peak, transforming the United States into the world’s largest oil producer.
This surge reshaped supply elasticity, diluted OPEC’s traditional pricing power, and increased short-term volatility in WTI spot markets. Understanding the impact of US shale production on spot oil prices is essential for traders, refiners, and macro investors analyzing inventory cycles and global supply balances.
Key Takeaways
- US shale acts as a flexible swing supply in global oil markets.
- Rapid production growth typically pressures spot oil prices downward.
- The 2014–2016 shale expansion triggered a historic oil collapse.
- Post-2015 exports linked shale output directly to Brent pricing.
- Breakeven costs, rig counts, and capital discipline determine supply response.
Table of Contents
- The Rise of US Shale Production
- How Spot Oil Prices Are Determined
- Impact of US Shale Production on Spot Oil Prices
- The 2014–2016 Shale Crash Case Study
- Breakeven Costs, Rig Counts, and Supply Elasticity
- OPEC vs US Shale: Structural Power Shift
- US Oil Exports and the Brent-WTI Spread
- Inventory Data, SPR Releases, and Price Reactions
- Capital Discipline and Producer Hedging
- What This Means for Traders and Investors
- FAQ
- Final Thoughts
- Disclaimer
- Author
The Rise of US Shale Production
The US shale revolution accelerated after 2008 due to horizontal drilling and hydraulic fracturing innovations. Production from the Permian Basin, Bakken, and Eagle Ford dramatically expanded national output.
By 2023–2024, US crude production exceeded 13 million barrels per day, a level once thought structurally impossible. This scale of growth shifted the global oil supply curve and redefined spot pricing sensitivity.
Unlike conventional megaprojects that require years to develop, shale wells can be drilled and brought online within months. This shortened supply response cycle introduced a new pricing mechanism into global markets.
Official production data is regularly published by the U.S. Energy Information Administration (EIA), which tracks national output levels and basin-level performance.
How Spot Oil Prices Are Determined
Spot oil prices reflect immediate delivery conditions and are heavily influenced by futures pricing mechanisms. In the United States, West Texas Intermediate (WTI) functions as the benchmark for domestic spot valuation.
Prices respond to global supply-demand balances, OPEC decisions, refinery utilization rates, inventory changes, and currency strength. Because US shale production represents a large share of marginal supply growth, output shifts directly affect WTI expectations.
WTI futures contracts trade on the CME Group’s NYMEX exchange, forming the foundation of U.S. spot pricing benchmarks.
WTI functions as the primary U.S. benchmark, and understanding its pricing structure is essential when comparing global oil benchmarks such as Brent crude, which we explain in detail in our guide on Understanding WTI vs. Brent Crude Oil: Key Differences.
Impact of US Shale Production on Spot Oil Prices
The impact of US shale production on spot oil prices becomes most visible during periods of rapid drilling expansion. When shale output rises faster than global demand growth, excess supply pressures spot prices lower.
Conversely, when drilling activity slows due to capital constraints or lower prices, supply tightens and prices stabilize. This supply elasticity reduces the probability of prolonged price spikes unless geopolitical disruptions constrain global production.
Shale’s rapid decline rates require continuous reinvestment, linking capital markets directly to oil price volatility.
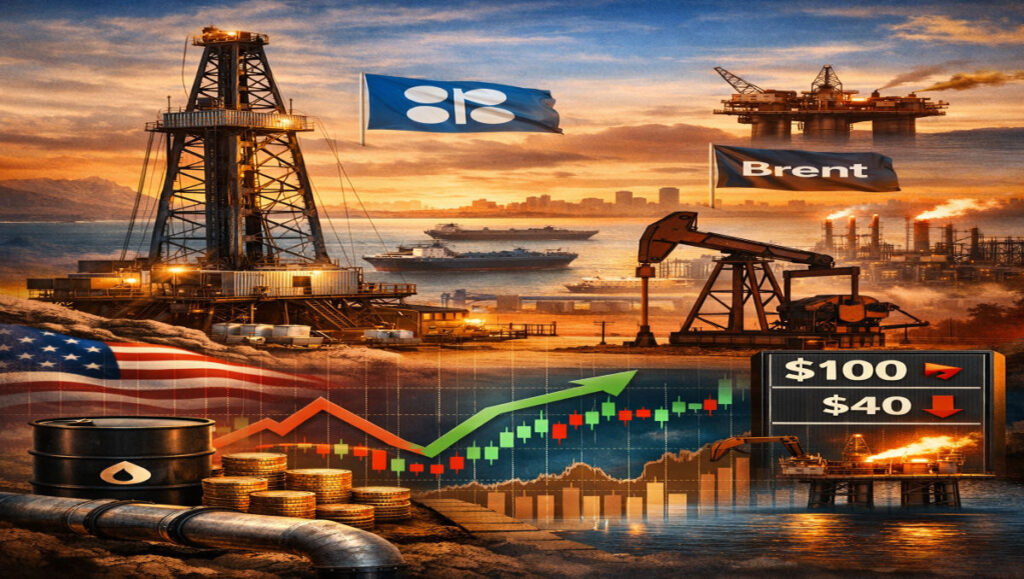
The 2014–2016 Shale Crash Case Study
Between 2011 and mid-2014, US shale production expanded aggressively. During this period, Brent crude traded above $100 per barrel.
As global supply surged and OPEC declined to cut output in late 2014, oversupply intensified. Oil prices collapsed from above $110 per barrel to below $40 by early 2016.
This episode demonstrated how unchecked shale expansion could overwhelm demand growth and force dramatic spot price corrections. It also pushed producers to lower breakeven costs and improve drilling efficiency.
Breakeven Costs, Rig Counts, and Supply Elasticity
Shale breakeven costs vary by basin, with the Permian Basin among the lowest-cost regions globally. Some operators remain profitable near $40–50 per barrel, while others require higher price thresholds.
Rig count data, published weekly by Baker Hughes, often signals future production trends. Rising rig counts typically precede higher output, while declining counts signal tightening supply conditions.
This measurable responsiveness explains why the impact of US shale production on spot oil prices remains structurally linked to drilling activity.
Forward-looking drilling trends are often measured through weekly Baker Hughes rig count reports, which serve as a leading indicator for future shale production growth.
OPEC vs US Shale: Structural Power Shift
Before the shale era, OPEC largely controlled global pricing power through coordinated production quotas. Saudi Arabia’s output decisions frequently dictated spot price direction.
The rise of US shale diluted this control. When OPEC cuts production to support prices, higher prices incentivize US shale producers to increase drilling, offsetting some of the intended price support.
This competitive dynamic becomes especially clear during coordinated supply adjustments, as discussed in our analysis of How OPEC Meetings Impact US Gasoline Prices.
This structural competition reshaped global oil geopolitics and introduced a more decentralized pricing environment.
US Oil Exports and the Brent-WTI Spread
The lifting of the US crude export ban in 2015 marked a turning point. Since then, US shale output has flowed directly into international markets.
As exports expanded, the Brent-WTI spread narrowed because US crude began competing with global supply benchmarks. Consequently, the impact of US shale production on spot oil prices now extends beyond domestic markets into global pricing frameworks.
Inventory Data, SPR Releases, and Price Reactions
Weekly petroleum status reports from the US Energy Information Administration provide production and inventory updates that frequently move markets. Inventory builds typically pressure spot prices lower, while unexpected draws provide support.
Additionally, Strategic Petroleum Reserve (SPR) releases have occasionally added temporary supply into markets, amplifying short-term price volatility. These government interventions highlight how policy decisions can interact with shale supply trends.
These inventory fluctuations further amplify the impact of US shale production on spot oil prices in short-term trading environments.
Capital Discipline and Producer Hedging
Following the 2014–2016 collapse and the 2020 pandemic shock, shale producers adopted stronger capital discipline. Shareholder returns increasingly replaced aggressive growth as a priority.
Producers also use hedging strategies to lock in future prices, reducing exposure to spot volatility. This capital discipline has moderated production growth compared to earlier expansion cycles.
Capital allocation decisions directly influence the long-term impact of US shale production on spot oil prices.
Therefore, while shale remains elastic, financial constraints now influence the magnitude of its response.
What This Means for Traders and Investors
For short-term traders, US shale production data and rig counts provide leading indicators of supply-driven volatility. Unexpected output growth often pressures WTI lower in futures markets.
For long-term investors, shale elasticity reduces the likelihood of sustained price spikes but increases cyclical volatility. Monitoring production trends alongside global demand remains critical for macro positioning.
Understanding the impact of US shale production on spot oil prices enables clearer interpretation of supply-driven price cycles.
Demand-side forces also influence price reactions, particularly transportation consumption patterns outlined in Factors Driving Oil Demand in the Transportation Sector.
Frequently Asked Questions
Does higher US shale production always lower spot oil prices?
Not necessarily. Price impact depends on demand growth, OPEC policy, inventory levels, and geopolitical risk.
Why are rig counts important?
Rig counts provide forward-looking signals about future production growth and supply trends.
Did shale cause the 2014 oil crash?
Shale expansion contributed to oversupply, but OPEC’s refusal to cut output intensified the price collapse.
How do exports affect global oil pricing?
Since 2015, US exports have linked domestic shale output directly to global Brent benchmarks.
Can government policy influence shale’s impact?
Yes. SPR releases, environmental regulation, and export policy can temporarily alter supply expectations.
Final Thoughts
The impact of US shale production on spot oil prices represents one of the most transformative developments in modern energy economics. By introducing flexible, technology-driven supply, shale has permanently altered the structure of global oil pricing power.
While elasticity reduces extreme price spikes during shortages, it also increases cyclical volatility during expansion phases. As long as technological innovation, capital discipline, and export integration continue, US shale production will remain a central determinant of both domestic and global spot oil dynamics.
The impact of US shale production on spot oil prices will remain a defining variable in global crude pricing cycles over the next decade.
Disclaimer
This article is for informational purposes only and does not constitute financial or investment advice. Oil markets are volatile and influenced by economic, geopolitical, and regulatory risks.
Author
US Commodity Price Research Desk
Independent macro-level analysis covering energy, metals, and agricultural commodity markets.