The 2026 renewable energy metals trading outlook centers on lithium and copper as core electrification assets. Institutional demand, EV expansion, grid modernization, and constrained mine supply are reshaping global pricing dynamics. Investors positioning early in renewable energy metals trading may benefit from structural growth, cyclical volatility, and long-term infrastructure transformation.
Key Takeaway
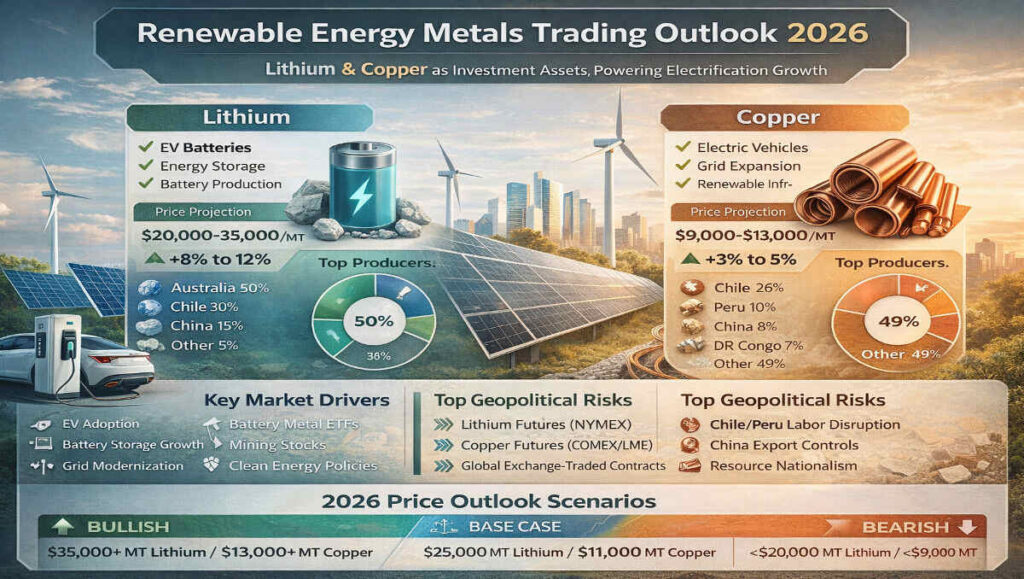
The 2026 renewable energy metals trading outlook shows lithium driving battery growth and copper anchoring electrification infrastructure, creating a dual-engine opportunity for disciplined institutional strategy.
Table of Contents
- Structural Drivers Behind Renewable Energy Metals
- 2026–2035 Demand Forecast Model
- Lithium Market Outlook 2026
- Copper Market Outlook 2026
- Supply Chain Concentration and Geopolitical Risk
- Historical Volatility and Correlation Analysis
- Price Projection Bands (2026–2030)
- Tactical Trading Strategy Framework
- Risk Management and Position Sizing
- What Is There for US Investors
- Frequently Asked Questions
- Final Strategic Outlook
- Disclaimer
- Author
Structural Drivers Behind Renewable Energy Metals
Renewable energy metals trading is fundamentally driven by electrification intensity. Lithium powers battery storage systems for electric vehicles and grid-scale storage. Copper supports electricity transmission, renewable generation infrastructure, charging networks, and industrial electrification.
Electric vehicles require significantly more copper than combustion vehicles. Battery storage expansion increases lithium intensity per megawatt installed. Grid modernization programs across North America, Europe, and Asia further accelerate copper demand.
The 2026 renewable energy metals trading outlook reflects a structural capital cycle rather than a temporary commodity spike.
2026–2035 Demand Forecast Model
Institutional projections estimate lithium demand growth between eight and twelve percent annually through 2035, supported by electric vehicle penetration and stationary battery systems.
According to the International Energy Agency’s global EV outlook, battery demand growth remains a primary structural driver of lithium consumption.
Copper demand growth is projected between three and five percent annually, driven by grid upgrades, industrial automation, and infrastructure spending.
By 2030, electrification-related demand could account for a materially higher share of total copper consumption compared to pre-2020 levels.
Renewable energy metals trading therefore aligns with long-duration structural capital expenditure programs.
Lithium Market Outlook 2026
Lithium markets remain supply-sensitive. Production is concentrated in Australia, Chile, and Argentina, while processing capacity is heavily centered in China.
Global lithium production data published by the U.S. Geological Survey confirms continued supply concentration across Australia and South America.
The 2026 renewable energy metals trading outlook suggests that lithium pricing will remain volatile due to delayed project timelines and capital-intensive mine expansion.
Lithium historically exhibits boom-bust cycles. When EV demand accelerates faster than mine commissioning, prices rise sharply. When supply expansion overshoots, corrections follow.
Institutional traders focus on inventory levels, contract renegotiations, and project development timelines.
Copper Market Outlook 2026
Copper trades transparently on COMEX and the London Metal Exchange. It remains one of the most liquid industrial metals globally.
Copper demand correlates with manufacturing activity, housing construction, renewable infrastructure, and macroeconomic expansion.
Copper futures traded on COMEX provide transparent price discovery for institutional participants.
For daily structural updates on US oil benchmarks that influence industrial metals sentiment, see our latest Crude Oil Market Status Today (WTI) analysis.
The 2026 renewable energy metals trading outlook for copper is supported by electrification investment and constrained global mine supply.
Copper often functions as a macroeconomic indicator. When infrastructure spending rises, copper strengthens.
Supply Chain Concentration and Geopolitical Risk
Lithium supply concentration introduces geopolitical exposure. Environmental permitting delays and water resource constraints in South America can disrupt output.
Resource nationalism trends in Latin America have been documented by the World Bank in its global commodity market reviews.
Copper supply concentration in Chile and Peru introduces political and labor-related risk.
Renewable energy metals trading must account for jurisdictional exposure, permitting timelines, and national resource policies.
Supply disruptions historically trigger significant price reactions in concentrated commodity markets.
Historical Volatility and Correlation Analysis
Lithium has historically demonstrated higher volatility relative to copper due to thinner liquidity and contract-based pricing mechanisms.
Industrial metals often move alongside broader commodity cycles, which we analyze in our Gold Price Today in USA report, helping investors understand cross-asset correlation dynamics.
Copper typically exhibits moderate volatility aligned with global GDP cycles.
Correlation analysis shows copper maintains measurable correlation with industrial indices, while lithium remains more thematic and growth-sensitive.
The 2026 renewable energy metals trading outlook requires balancing volatility against structural growth potential.
Price Projection Bands (2026–2030)
Institutional scenario modeling suggests lithium may experience wide trading ranges depending on EV penetration rates and mine development schedules.
Copper projection bands depend heavily on infrastructure investment and supply expansion timelines.
Bullish scenario: supply constraints + accelerated electrification.
Base scenario: steady growth + moderate supply response.
Bearish scenario: demand slowdown + oversupply commissioning.
Renewable energy metals trading requires dynamic scenario planning rather than static forecasting.
Tactical Trading Strategy Framework
Institutional renewable energy metals trading strategies typically combine:
Core allocation in diversified miners.
Thematic ETF exposure for structural participation.
Selective futures positioning for tactical opportunities.
Strategic allocation favors copper for stability and lithium for growth acceleration.
Timing often aligns with inventory cycles, EV sales data, and infrastructure spending announcements.
Risk Management and Position Sizing
Renewable energy metals trading involves cyclical drawdowns. Lithium may experience significant corrections during oversupply phases. Copper declines during recessionary environments.
Disciplined allocation typically limits exposure to single-digit portfolio percentages depending on risk tolerance.
Risk management frameworks include staggered entry strategies, diversification across metals, and macroeconomic monitoring.
Investors comparing renewable energy metals trading with agricultural commodity cycles may also review our analysis on Price Trends for Organic vs Conventional Wheat to evaluate diversification benefits.
What Is There for US Investors
US investors benefit from access to deep capital markets, commodity ETFs, mining equities listed on US exchanges, and regulated futures contracts.
US investors tracking geopolitical exposure in energy markets can also review our detailed report on How Do Geopolitical Risks Impact Oil Supply Chains for broader macro context.
Renewable energy metals trading allows US investors to participate in domestic electrification initiatives, infrastructure spending programs, and global EV expansion.
Tax treatment varies by instrument. ETFs provide simplicity, while futures contracts involve specific regulatory and tax considerations.
Strategic exposure can complement broader equity and commodity allocations within diversified portfolios.
Frequently Asked Questions
What makes lithium different from traditional commodities?
Lithium pricing is more contract-driven and supply-concentrated.
Why is copper considered an electrification backbone metal?
Copper enables electricity transmission and renewable generation infrastructure.
Is renewable energy metals trading cyclical?
Yes. Structural growth overlays traditional industrial cycles.
Can supply expansion reduce prices?
Yes. New mine commissioning can moderate pricing pressure.
Are these metals inflation hedges?
Partially. However, they are primarily growth-sensitive industrial assets.
Is long-term demand guaranteed?
Demand depends on policy, technological adoption, and macroeconomic stability.
Final Strategic Outlook
The 2026 renewable energy metals trading outlook confirms lithium and copper as core electrification assets. Lithium offers high-growth acceleration tied to battery expansion. Copper provides structural stability anchored in infrastructure and industrial demand.
Institutional positioning favors diversified exposure, disciplined risk management, and long-term thematic alignment.
Electrification capital cycles remain intact. Volatility remains inevitable. Strategic allocation remains essential.
Disclaimer
This publication is for informational and educational purposes only. It does not constitute financial, investment, or trading advice. Commodity markets involve risk, including potential capital loss. Investors should conduct independent research and consult licensed professionals before making investment decisions.
Author
The US Commodity Research Desk specializes in macro-driven commodity analysis, renewable energy metals strategy, and institutional-grade market outlook reporting. Our team focuses on supply-demand modeling, geopolitical risk assessment, futures market structure, and long-term electrification trends impacting lithium and copper markets.