The comparison between WTI vs. Brent crude oil sits at the foundation of global energy pricing. These two benchmarks determine how most crude contracts are valued worldwide and influence gasoline prices, inflation expectations, refinery margins, and energy equities.
Although both are classified as light sweet crude, the pricing behavior of WTI vs. Brent crude oil is driven far more by geography, logistics, infrastructure, and global trade flows than by minor quality differences. Understanding their structural differences helps investors interpret spread movements, supply tightness, and regional imbalances in oil markets.
Key Takeaways
- WTI and Brent are the dominant global oil benchmarks.
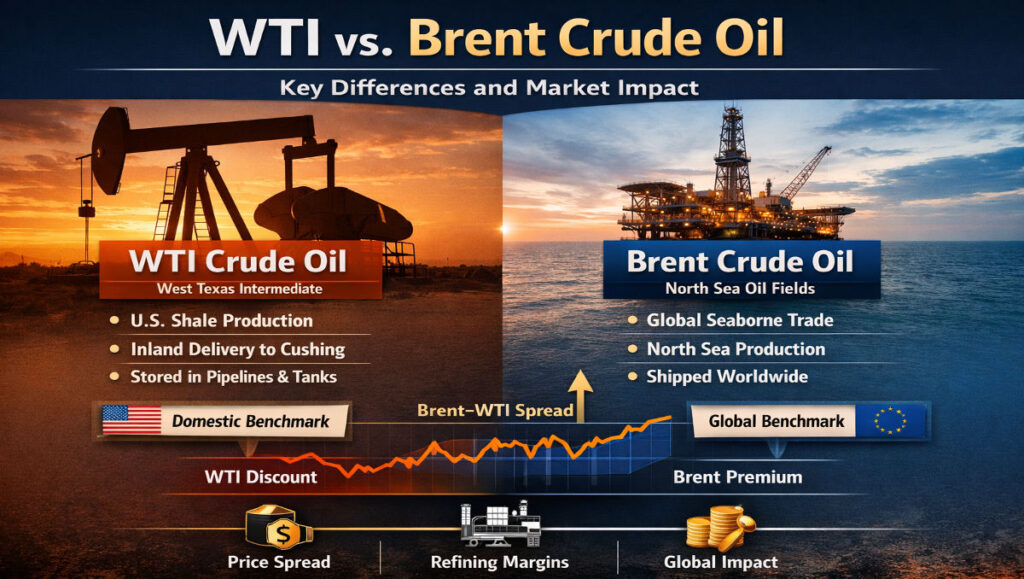
- Brent reflects global seaborne oil pricing.
- WTI reflects U.S. inland supply dynamics.
- Infrastructure constraints significantly influence price spreads.
- The Brent–WTI spread signals regional imbalance.
- Market structure conditions affect both benchmarks differently.
Table of Contents
- What Is WTI Crude Oil?
- What Is Brent Crude Oil?
- Quality Differences in WTI vs. Brent Crude Oil
- Geography and Logistics Behind WTI vs. Brent Crude Oil
- Historical Brent–WTI Spread Behavior
- Market Structure in WTI vs. Brent Crude Oil
- Refinery Margins and Crack Spread Implications
- Market Indicators to Monitor
- Outlook for WTI vs. Brent Crude Oil
- What This Means for Investors
- FAQ: WTI vs. Brent Crude Oil Explained
- Final Thoughts
What Is WTI Crude Oil?
West Texas Intermediate (WTI) is a U.S. crude oil benchmark delivered at Cushing, Oklahoma, one of the largest storage and pipeline hubs in North America.
WTI typically has an API gravity of 39–40 degrees and sulfur content around 0.24%, making it slightly lighter and sweeter than Brent. Its inland delivery mechanism means that WTI pricing reflects U.S. production levels, especially shale output from the Permian Basin, as well as storage capacity and pipeline infrastructure.
When evaluating WTI vs. Brent crude oil, it is important to understand that WTI reacts strongly to domestic production growth and export capacity changes.
To understand how U.S. gasoline prices react to crude movements, read our detailed breakdown in How OPEC Meetings Impact US Gasoline Prices, where we explain the transmission from global supply decisions to pump prices.
According to the U.S. Energy Information Administration (EIA), WTI is the primary U.S. crude benchmark traded on NYMEX and delivered at Cushing, Oklahoma.
What Is Brent Crude Oil?
Brent crude originates from the North Sea and serves as the global pricing benchmark for roughly two-thirds of internationally traded crude oil.
Brent carries an API gravity near 38 degrees and sulfur content around 0.37%. While marginally heavier than WTI, it remains high-quality light sweet crude.
The defining distinction in WTI vs. Brent crude oil lies in transportation flexibility. Brent is waterborne and globally tradable, making it more responsive to OPEC policy, Middle East supply risks, European demand, and global shipping flows.
For a broader view of how global oil benchmarks fit into energy markets, see our analysis on How Renewable Energy Trends Impact Fossil Fuel Commodities, which explains long-term structural demand shifts.
Brent crude futures are traded globally on ICE Futures Europe, making Brent the leading international oil pricing benchmark.
Quality Differences in WTI vs. Brent Crude Oil
From a refining perspective, WTI’s slightly higher API gravity yields marginally more gasoline and distillates. Its lower sulfur content reduces refining costs.
However, these compositional differences play a secondary role in determining price spreads. The divergence in WTI vs. Brent crude oil is overwhelmingly driven by structural and logistical factors rather than sulfur levels or density alone.
Geography and Logistics Behind WTI vs. Brent Crude Oil
Geography is the dominant force shaping the relationship between WTI vs. Brent crude oil.
WTI is delivered inland at Cushing. During periods of rapid shale production growth, infrastructure bottlenecks can cause regional oversupply, pushing WTI into a discount relative to Brent.
Brent, being seaborne, reflects global demand conditions and adjusts more efficiently to international trade flows.
As U.S. export terminals expanded along the Gulf Coast over the past decade, some of the historical discount between WTI vs. Brent crude oil narrowed, though spreads remain sensitive to production surges.
Historical Brent–WTI Spread Behavior
Prior to the shale boom, WTI frequently traded at a premium to Brent.
Between 2011 and 2014, surging U.S. shale production overwhelmed inland infrastructure, causing WTI to trade at a sustained discount that exceeded $20 per barrel at times.
The most extreme structural dislocation occurred in April 2020 when WTI futures briefly traded below zero due to storage constraints at Cushing. Brent did not experience negative pricing because its waterborne structure allowed for more flexible storage and shipment options.
The spread between Brent and WTI also influences inflation expectations and industrial costs, similar to how benchmark shifts impact metals markets in Aluminum Market Trends in Aerospace and Construction.
These historical episodes demonstrate how structural mechanics influence WTI vs. Brent crude oil pricing relationships.
WTI futures contracts are listed on the CME Group exchange, which publishes detailed contract specifications and trading data.
Market Structure in WTI vs. Brent Crude Oil
Market structure conditions such as contango and backwardation further shape pricing behavior.
In backwardation, near-term contracts trade above future contracts, signaling tight supply. In contango, future contracts trade above spot prices, indicating surplus conditions.
WTI is particularly sensitive to storage-driven contango due to its inland delivery mechanism. Brent, with broader shipping access, may respond differently under similar macro conditions.
Understanding market structure dynamics within WTI vs. Brent crude oil helps investors assess whether price moves reflect structural tightness or temporary inventory imbalances.
Refinery Margins and Crack Spread Implications
Refineries convert crude oil into gasoline, diesel, and jet fuel. The difference between refined product prices and crude input costs is known as the crack spread.
When WTI trades at a discount to Brent, U.S. refiners may benefit from lower input costs, expanding margins. Conversely, international refiners more closely tied to Brent may experience different margin dynamics.
Seasonal demand patterns, export flows, and refining capacity utilization can indirectly influence the spread between WTI vs. Brent crude oil.
Market Indicators to Monitor
To properly evaluate WTI vs. Brent crude oil, investors should monitor:
Weekly U.S. crude inventory data from the Energy Information Administration.
Cushing storage levels.
U.S. crude export volumes.
OPEC production decisions and compliance rates.
Global freight and shipping costs.
These indicators help determine whether spread movements reflect structural supply-demand changes or short-term speculative positioning.
The International Energy Agency (IEA) regularly publishes oil market reports explaining how Brent pricing influences global supply and trade flows.
Outlook for WTI vs. Brent Crude Oil
Looking ahead, the outlook for WTI vs. Brent crude oil will depend on several structural factors.
U.S. shale production growth and export infrastructure expansion will influence WTI’s pricing relative to Brent. If production growth outpaces export capacity, spreads could widen.
OPEC production policy and geopolitical developments will continue to impact Brent pricing more directly. Tight global markets tend to narrow the spread, while regional oversupply in the United States can widen it.
As global energy demand evolves and infrastructure adjusts, the relationship between WTI vs. Brent crude oil will likely remain dynamic rather than static.
What This Means for Investors
Understanding WTI vs. Brent crude oil improves clarity when evaluating oil ETFs, futures contracts, and energy equities.
U.S.-focused oil ETFs and futures are typically linked to WTI pricing, while many global energy companies and international oil funds respond more closely to Brent.
When the Brent–WTI spread widens, U.S. shale producers may experience pricing pressure while refiners benefit. When the spread narrows, global tightening conditions may be emerging.
Recognizing which benchmark drives a particular asset enhances risk management and improves portfolio positioning decisions.
Investors comparing oil exposure to other commodities may also find our guide on Physical Gold vs. Gold ETFs: Pros and Cons for US Investors helpful for understanding commodity allocation strategies.
FAQ: WTI vs. Brent Crude Oil Explained
Why does Brent usually trade above WTI?
Brent reflects global seaborne pricing and incorporates geopolitical risk premiums.
Can WTI trade at a premium?
Yes. Historically, WTI traded above Brent before U.S. infrastructure bottlenecks emerged.
What caused negative WTI prices in 2020?
Storage constraints at Cushing combined with collapsing demand during the pandemic.
Which benchmark influences U.S. gasoline prices?
Retail fuel markets are globally integrated, so Brent often has significant influence.
Final Thoughts
The relationship between WTI vs. Brent crude oil extends beyond minor differences in sulfur content or API gravity. Geography, logistics, storage dynamics, export infrastructure, and geopolitical risk all shape pricing spreads.
WTI reflects U.S. inland supply conditions, while Brent captures global seaborne market tightness and international risk premiums. Monitoring the structural drivers behind WTI vs. Brent crude oil provides valuable insight into regional imbalances and broader energy market trends.
For investors and traders, understanding these benchmark dynamics strengthens interpretation of oil price volatility and enhances strategic energy exposure decisions.
Author
US Commodity Price Research Team
Independent commodity market analysis focused on structural supply-demand dynamics, global benchmark behavior, and macro-driven energy trends.
Disclaimer
This content is for informational and educational purposes only and does not constitute financial advice. Energy markets are volatile and subject to geopolitical, regulatory, and economic risks. Investors should conduct independent research or consult a qualified financial advisor before making investment decisions.